ToxProfiler1 is a web-based tool that predicts the potential of a chemical to interact with 64 toxicity targets. ToxProfiler provides a complementary computational approach to experimental in vitro screening. It aids in understanding the adverse liability associated with chemicals and provides insights into the underlying mechanisms of toxicity.
ToxProfiler uses a chemical-similarity-based read-across approach to generate toxicity target profiles for query chemicals.1 Chemical similarity between each query compound and a set of reference compounds (target representative set) known to interact with the toxicity target of interest is calculated, and the maximum similarity score (MAX) between them is used to represent the potential of the query to interact with the toxicity target. Figure 1 summarizes the overall workflow of this tool.
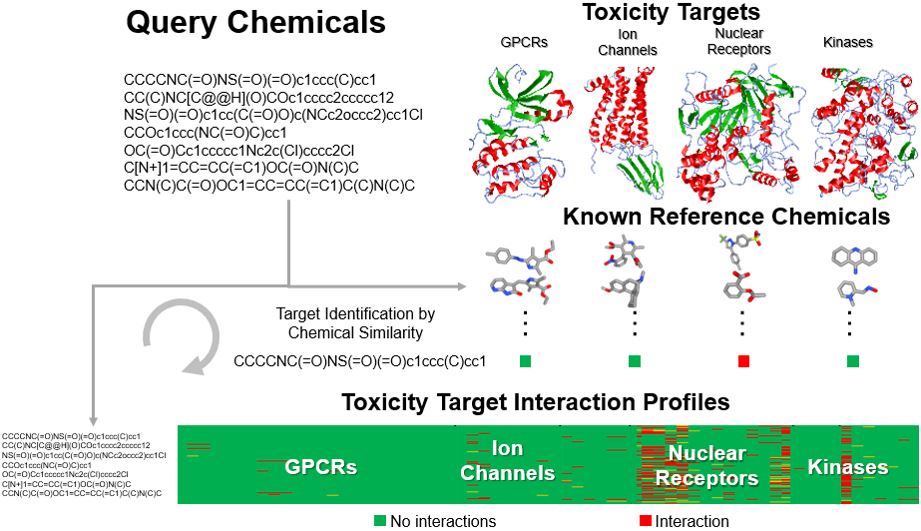
Figure 1. ToxProfiler workflow. Users upload query molecules as SMILES which will be screened against reference molecules/target representatives associated with each toxicity target, and the MAX similarity score is used to create a link between the query molecule and the toxicity target.
ToxProfiler has three basic building blocks. They are: 1) a panel of toxicity targets, 2) a set of target representatives or reference compounds, and 3) a suitable chemical similarity approach.
Toxicity targets panel
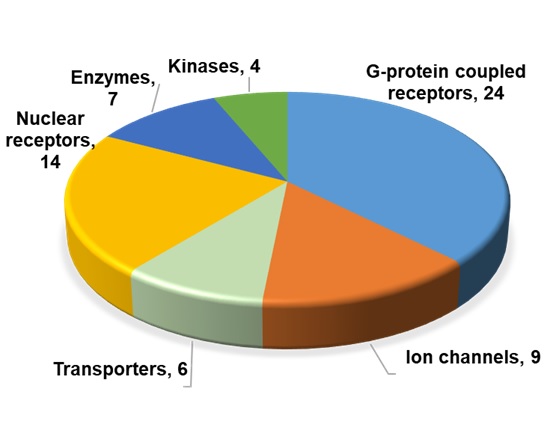
Figure 2. Protein classes of the 64 toxicity targets. Toxicity targets were grouped into six major protein classes, and the number of targets per class is given.
Toxicity targets represent molecular initiating events in adverse outcome pathways, i.e., chemical interaction with these targets is known to be causally linked with an adverse effect. We used two major sources to create the toxicity targets panel in this work, i.e., the collaborative data published from four major pharmaceutical companies and the U.S. National Tox21 collaborative program.2,3 Our panel includes 64 toxicity targets. Figure 2 shows the different protein classes represented in our toxicity targets panel. A majority of the targets in our panel are G-protein coupled receptors (GPCRs) (24 of 64) followed by nuclear receptors (14 of 64) and ion channels (9 of 64). It should be noted that 44 of the 64 targets are being used in a commercial in vitro safety screening panel such as Eurofins Cerep SafetyScreen44.4
Target representatives/Reference compounds
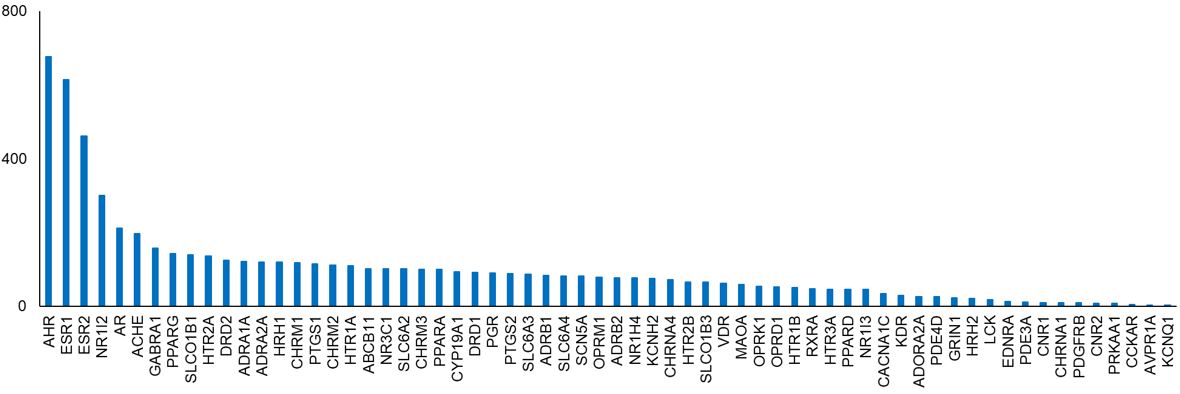
Figure 3. Number of target representatives per toxicity target.
Target representatives are compounds that are known to interact with these toxicity targets. We used two publicly available and well-recognized reference datasets, DrugBank and the Toxin and Toxin-Target Database, to create the target representative dataset.5,6 After pre-processing, we obtained a final chemical-toxicity target matrix with 2,655 chemicals and 64 toxicity targets. Each row in the matrix is a chemical, and each column is a toxicity target. The matrix has a value of 1 if there is a known interaction between the chemical and target; otherwise, it is 0. Overall, it is a sparse matrix with 1,300 chemicals (49%) interacting with only one target and 407 chemicals interacting with two targets. Forty-three of the 64 targets have more than 50 chemicals as target representatives, 14 targets have between 10 and 50 chemicals as target representatives, and seven targets have between 3 and 10 chemicals as target representatives. Aryl hydrocarbon receptor (AHR), estrogen receptors 1 and 2 (ESR1, ESR2), and pregnane X receptor (NR1I2) have the highest number (≥300) of target representatives (Figure 3). Vasopressin receptor 1A (AVPR1A) and voltage-gated potassium channel protein (KCNQ1) have the lowest number (three) of target representatives.
Chemical similarity approach
Chemical similarity can be calculated based on a 2D or 3D approach. The 2D approach uses atom connectivity/fingerprints. We used Pipeline Pilot extended-connectivity fingerprints with a diameter of four chemical bonds (ECFP4) for 2D similarity calculations. We evaluated the performance of the 2D and 3D approach (ROCS) using external data for 35 targets from ChEMBL. More details of this evaluation analysis can be found in our paper.1 We found the 2D approach to perform better in retrieving actives from inactives for each of the tested targets (Figure 4). Based on this, 2D similarity-based screening approach is implemented in ToxProfiler.
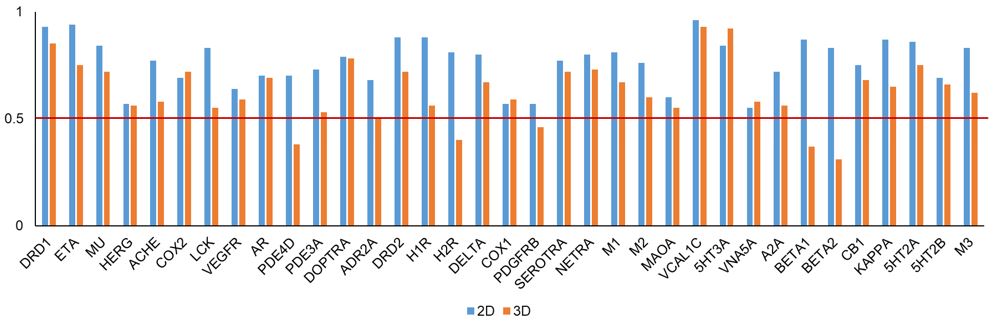
Figure 4. Receiver operating characteristic area under the curve (AUC) values using the 2D and 3D similarity approach across 35 targets in the external validation set. The names of each target are given in Table 1.
TABLE 1. Receiver operating characteristic area under the curve (AUC) values from the 2D and 3D approach across 35 targets in external validation analysis.
| No | NAME | SYMBOL | 2D | 3D | %Diff |
| 1 | D(1A) dopamine receptor | DRD1 | 0.93 | 0.85 | 9 |
| 2 | Endothelin-1 receptor | EDNRA | 0.94 | 0.75 | 25 |
| 3 | Mu-type opioid receptor | OPRM1 | 0.84 | 0.72 | 17 |
| 4 | Potassium voltage-gated channel subfamily H member 2 | KCNH2 | 0.57 | 0.56 | 2 |
| 5 | Acetylcholinesterase | ACHE | 0.77 | 0.58 | 33 |
| 6 | Prostaglandin G/H synthase 2 | PTGS2 | 0.69 | 0.72 | -4 |
| 7 | Tyrosine-protein kinase Lck | LCK | 0.83 | 0.55 | 51 |
| 8 | Vascular endothelial growth factor receptor 2 | KDR | 0.64 | 0.59 | 8 |
| 9 | Androgen receptor | AR | 0.70 | 0.69 | 1 |
| 10 | cAMP-specific 3',5'-cyclic phosphodiesterase 4D | PDE4D | 0.70 | 0.38 | 84 |
| 11 | cGMP-inhibited 3',5'-cyclic phosphodiesterase A | PDE3A | 0.73 | 0.53 | 38 |
| 12 | Sodium-dependent dopamine transporter | SLC6A3 | 0.79 | 0.78 | 1 |
| 13 | Alpha-2A adrenergic receptor | ADRA2A | 0.68 | 0.50 | 36 |
| 14 | D(2) dopamine receptor | DRD2 | 0.88 | 0.72 | 22 |
| 15 | Histamine H1 receptor | HRH1 | 0.88 | 0.56 | 57 |
| 16 | Histamine H2 receptor | HRH2 | 0.81 | 0.40 | 103 |
| 17 | Delta-type opioid receptor | OPRD1 | 0.80 | 0.67 | 19 |
| 18 | Prostaglandin G/H synthase 1 | PTGS1 | 0.57 | 0.59 | -3 |
| 19 | Platelet-derived growth factor receptor beta | PDGFRB | 0.57 | 0.46 | 24 |
| 20 | Sodium-dependent serotonin transporter | SLC6A4 | 0.77 | 0.72 | 7 |
| 21 | Sodium-dependent noradrenaline transporter | SLC6A2 | 0.80 | 0.73 | 10 |
| 22 | Muscarinic acetylcholine receptor M1 | CHRM1 | 0.81 | 0.67 | 21 |
| 23 | Muscarinic acetylcholine receptor M2 | CHRM2 | 0.76 | 0.60 | 27 |
| 24 | Amine oxidase [flavin-containing] A | MAOA | 0.60 | 0.55 | 9 |
| 25 | Voltage-dependent L-type calcium channel alpha-1C | CACNA1C | 0.96 | 0.93 | 3 |
| 26 | 5-hydroxytryptamine receptor 3A | HTR3A | 0.84 | 0.92 | -9 |
| 27 | Sodium channel protein type 5 subunit alpha | SCN5A | 0.55 | 0.58 | -5 |
| 28 | Adenosine receptor A2a | ADORA2A | 0.72 | 0.56 | 29 |
| 29 | Beta-1 adrenergic receptor | ADRB1 | 0.87 | 0.37 | 135 |
| 30 | Beta-2 adrenergic receptor | ADRB2 | 0.83 | 0.31 | 168 |
| 31 | Cannabinoid receptor 1 | CNR1 | 0.75 | 0.68 | 10 |
| 32 | Kappa-type opioid receptor | OPRK1 | 0.87 | 0.65 | 34 |
| 33 | 5-hydroxytryptamine receptor 2A | HTR2A | 0.86 | 0.75 | 15 |
| 34 | 5-hydroxytryptamine receptor 2B | HTR2B | 0.69 | 0.66 | 5 |
| 35 | Muscarinic acetylcholine receptor M3 | CHRM3 | 0.83 | 0.62 | 34 |
ToxProfiler
In summary, we used 2,655 chemicals collected from public chemogenomics databases as target representatives to represent 64 toxicity targets and used a 2D similarity approach to compare the similarity between the query molecules with the reference set of molecules. Users can upload query chemicals in SMILES format. Users are also given an option to draw the compound of interest and add it as a query molecule. Users can view all of the results on the ToxProfiler itself or download them for offline analysis.
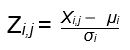
MAX 2D similarity Tanimoto scores between each query chemical and respective toxicity targets were calculated and converted into Z-score. The Z-score of chemical i for a toxicity target j is given by
 (1)
(1)
where X,j is the MAX Tanimoto score for chemical i and toxicity target j; μi is the average of MAX Tanimoto score for chemical i across all 64 toxicity targets; and σi is the standard deviation of the MAX Tanimoto score for chemical i across all 64 toxicity targets.
Figure 5. shows the snapshot of output obtained from ToxProfiler. For each query compound, ToxProfiler displays as output its name, structure, and a toxicity targets profile bar. The toxicity targets profile is color-coded based on the similarity to target representatives. Based on the Z-score range 1.96, 1.645-1.96, and <1.645, it is marked in red, yellow, and green, respectively.
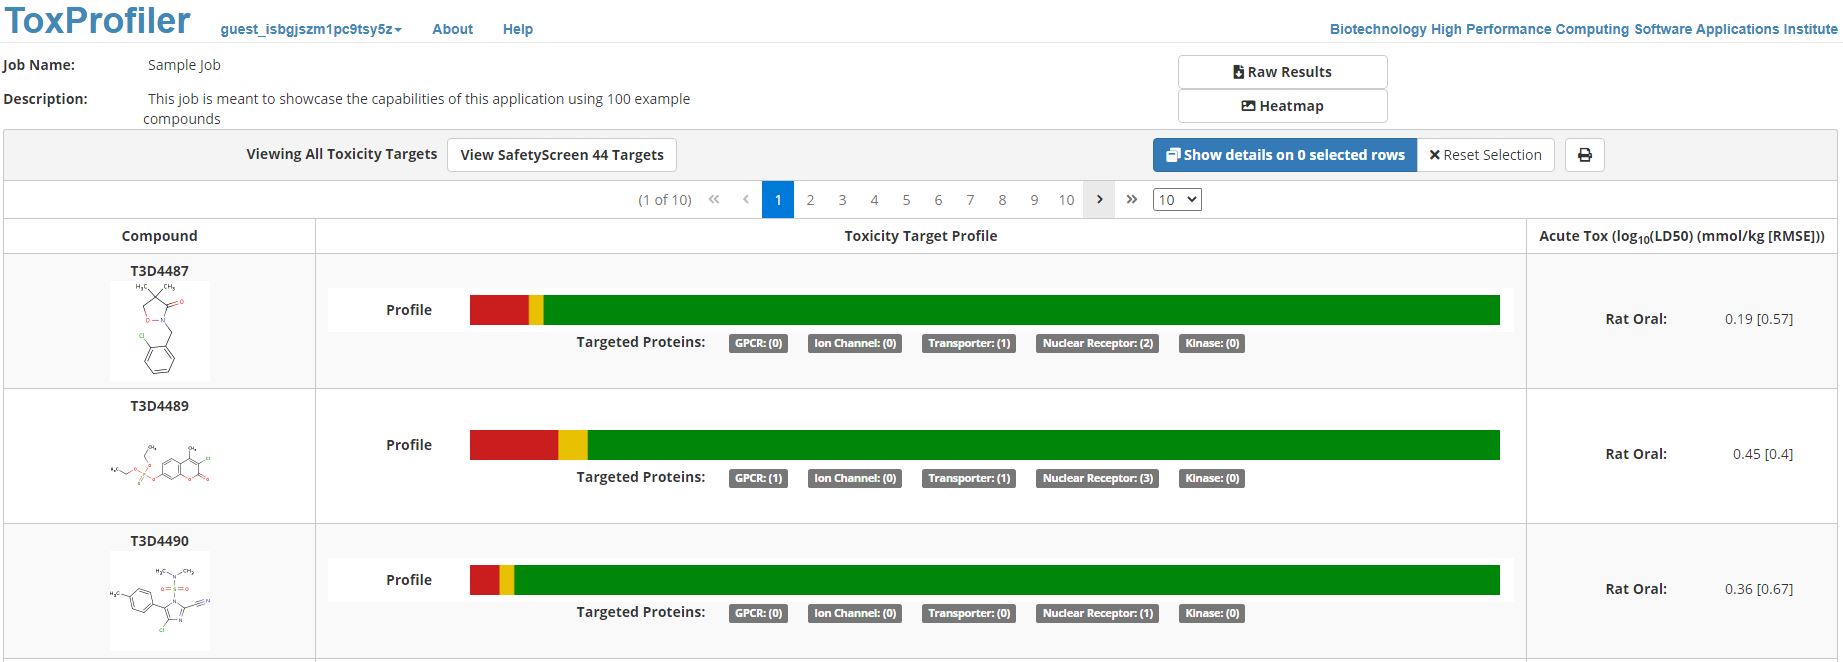
Figure 5. Screenshot of a typical result generated from ToxProfiler web tool. Each chemical in the user-uploaded query set is present in each row. The molecular structure of the chemical query is displayed along with a summary of toxicity targets profile and rat oral acute toxicity values. The summary of the toxicity targets profile is present as a bar plot. The red, yellow, and green color in the bar plot represents the number of predicted interactions, potential interactions, and lack of interactions with 64 toxicity targets, respectively.
Correction Based on Shuffling (CBOS) score
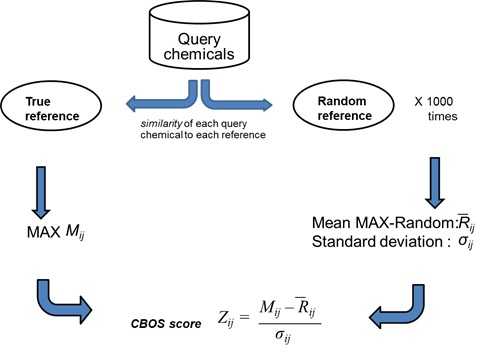
We have developed a Correction Based on Shuffling (CBOS) score that accounts for possibility that the observed similarity score between query and reference compounds is obtained randomly by chance. Randomization or shuffling of datasets, a commonly employed technique in computational biology studies to distinguish true signals from noise, has been successfully used to generate high-confidence protein-protein interaction networks from noisy, protein-interaction data that are prone to false positives. Motivated by its success, we developed and applied CBOS score to cheminformatics problem. The schematic of CBOS approach is provided in Figure 6.
 (1)
(1)
Figure 6. Schematic representation of correction based on shuffling (CBOS) score used in this tool. For each query compound, MAX score was calculated with the true reference set. Then 1000 random sets of compounds with equal number of compounds as used in true reference set was generated. Then similarity was calculated between each query compound and the random reference set. This process was repeated for all the 1000 random reference set and average MAX-random score and standard deviation of MAX-random score was calculated. This was used to convert the true MAX score into the CBOS score.
References
- AbdulHameed, M.D.M., Liu, R., Schyman, P., Sachs, D., Xu, Z., Desai, V., Wallqvist, A. (2021) ToxProfiler: Toxicity-target profiler based on chemical similarity. Comput Toxicol 18, 100162.
- Bowes, J., Brown, A. J., Hamon, J., Jarolimek, W., Sridhar, A., Waldron, G., and Whitebread, S. (2012) Reducing safety-related drug attrition: the use of in vitro pharmacological profiling. Nat Rev Drug Discov 11, 909-922.
- Tice, R. R., Austin, C. P., Kavlock, R. J., and Bucher, J. R. (2013) Improving the human hazard characterization of chemicals: a Tox21 update. Environ Health Perspect 121, 756-765.
- https://www.eurofinsdiscoveryservices.com/catalogmanagement/viewitem/SafetyScreen44-Panel-Cerep/P270
- Wishart, D. S., Feunang, Y. D., Guo, A. C., Lo, E. J., Marcu, A., Grant, J. R., Sajed, T., Johnson, D., Li, C., Sayeeda, Z., Assempour, N., Iynkkaran, I., Liu, Y., Maciejewski, A., Gale, N., Wilson, A., Chin, L., Cummings, R., Le, D., Pon, A., Knox, C., and Wilson, M. (2018) DrugBank 5.0: a major update to the DrugBank database for 2018. Nucleic Acids Res 46, D1074-D1082.
- Wishart, D., Arndt, D., Pon, A., Sajed, T., Guo, A. C., Djoumbou, Y., Knox, C., Wilson, M., Liang, Y., Grant, J., Liu, Y., Goldansaz, S. A., and Rappaport, S. M. (2015) T3DB: the toxic exposome database. Nucleic Acids Res 43, D928-934.